
How to trade?
Stock investing can have two main forms: long-term and short-term investing, also know as trading. Formerly, stock investing used to be made in person on an investment company or bank, where the investor walked to the counter and paid the broker to buy the stocks. Over the time and the use of the telephone, stock investing began a new phase where the investor simply made a call to the broker on the phone and asked that the stocks he wanted or the stock the broker advised were bought or sold. Nowadays, the order to execute the operations of buy and sell can be made also by a simple mouse click on an investment platform.
The main financial instruments related to stock investing and trading are direct buying, which is the acquisition of a number of stocks to be held on your name; through participation units on an investment fund which will invest on a portfolio managed by the fund creator, the investment company; through participations on an ETF, which is an investment fund whose participation units are traded on an exchange just like stocks and whose management is also made by its creator, an investment company. Also, and refering to trading, the usual investment instrument are CFDs or Contracts For Difference, which are very risky due to the leverage required and the timeline of the “bet” on the upward or downward tendency of an underlying asset.
The main platforms for stock investing are banks, specialized brokers and discount brokers. Banks are the traditional broker and continue to be relied by many investors as a safe way to invest in stocks, bonds and other instruments. Specialized brokers usually only do services of brokerage and advisory, they don’t hold the deposits of the investors or the stocks, they subcontract banks and other financial institutions for those means. Discount brokers offer very low comissions to their clients as they only do services of brokerage and usually are only available online so their costs will be lower.
How to analyze?
Fundamental analysis

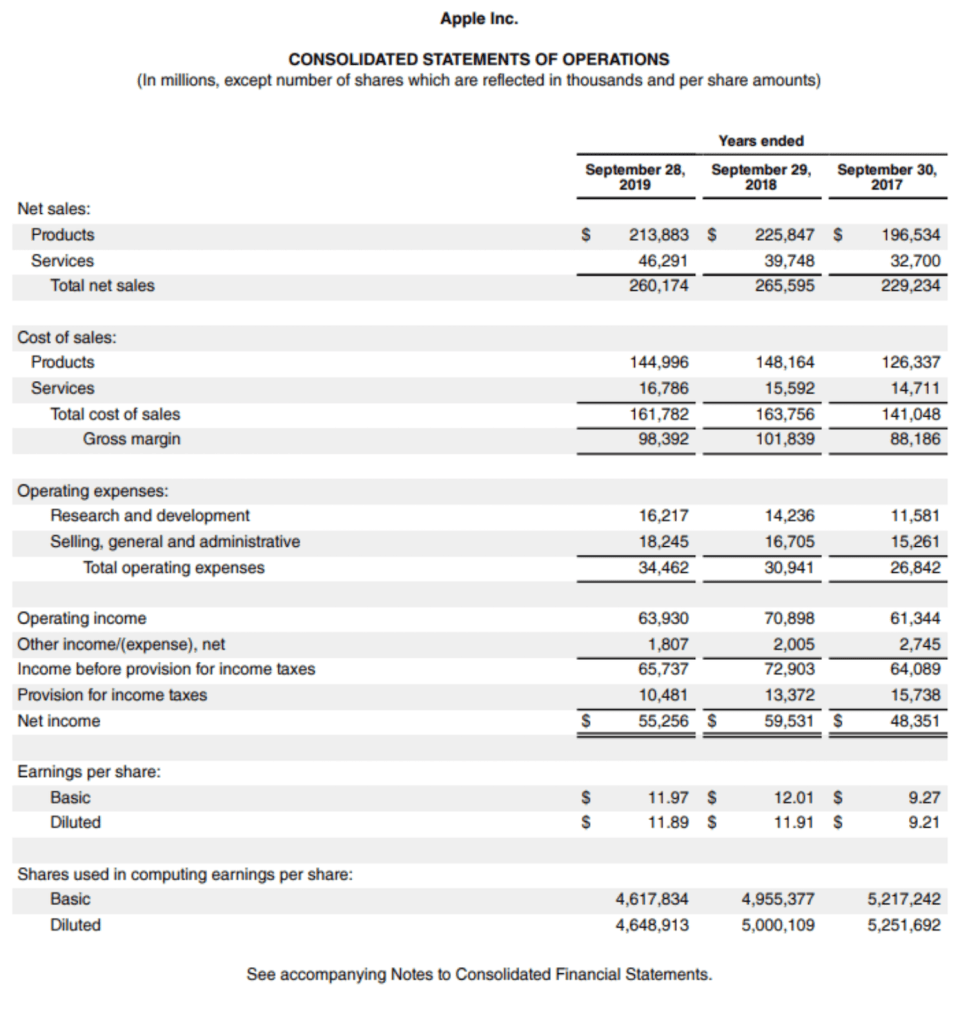
This analysis is made to the financial information of a company, mainly it’s ratios, like EPS (earning per share) and PER (price earning ratio), in order to understand the financial health and evaluate the investment. Companies share regularly, and atleast once every year, the financial statements, composed by the Balance Sheet, Income Statement, Cashflow Statement and Statement of Changes in Shareholder Equity and also non-financial statements that help to read the corporate environment.
There are many ratio categories, they can be liquidity ratios, leverage, efficiency, profitability and market value ratios. The main ratios are presented below:
- PER: the Price-Earnings Ratio measures the relation between the stock price and the earnings presented by the company and is the division of the former by the latter;
- EPS: Eanings per Share is self-explanatory, just divide the companies earnings by the number of shares that are in issued or in circulation;
- Current ratio: this ratio calculates the capacity of the company’s short-term assets to cover the short-term liabilities;
- Debt ratio: dividing the total liabilities by the total assets, we get the debt ratio, which tells us the capacity of the company to pay its debts using all its assets;
- Debt to Equity ratio: different from the ratio above, this one compares the debt to the shareholder’s equity, measuring how much of the debt can be paid by equity;
- Asset turnover: an operational ratio, this one divides the sales by the total assets in order to understand how much sales can the assets produce;
- Inventory turnover: another operational ratio, this one divides the cost of goods sold in a given period by the average inventory, so we can understand how many times the company’s inventory is replaced;
- Day sales in inventory ratio: dividing 365 days by the inventory turnover ratio, it shows how many days does it take to complety sell the inventory;
- Return on assets ratio: this ratio divides the earnings by the company’s total assets, to show the rentability of the assets;
- Return on equity ratio: similar to the one above, this ratio divides the earnings by the shareholder’s equity in order to show the rentability of the equity, meaning, the rentability of the shareholder’s investment on the company;
- Dividend yield: when we divide the dividends by the share price, we get the dividend yield, representing the percentage of the earnings that are distributed in relation to the investment made on the share.
Technical Analysis
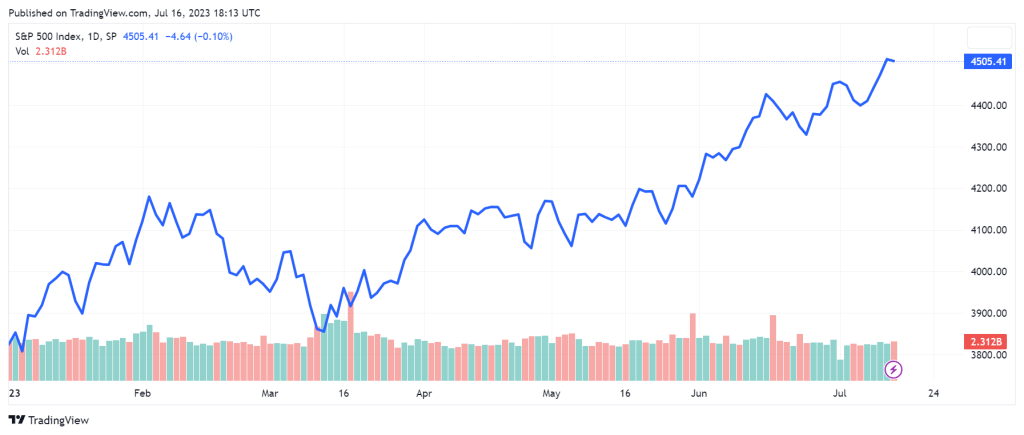
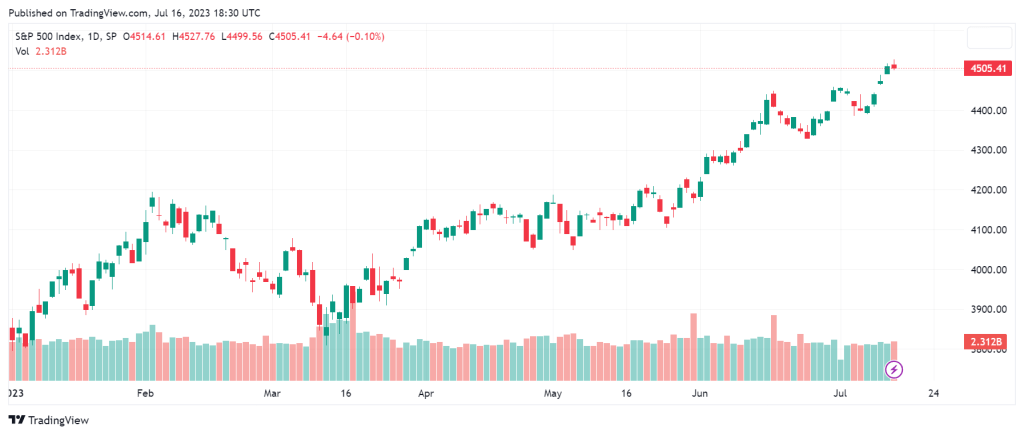
In this analysis, our focus is to predict the market swings based on historic moves of the price and volume of transactions of a share. This means that we should open the graphic with the historical prices of a share, be it in a continuous line that can, for example, point the price of a stock in any given day for the past year, or the usual candlestick charts, which also show the maximum and minimum prices of a share on any given day. With technical analysis, the investor uses patterns to predict if the market is going up or down, in any given hour, day, week or even month(s), which is usually the framework of day traders.
There are various patterns, but the main ones are the following:
- Double Top/Bottom: occurs when the price line presents two spikes above or below, in the shape of an “M” or “W”, and may signify that the price is going down on the first case or going up in the latter.
- Head and Shoulders: this is one of the most know patterns, represented by three spikes, with the middle one being a price superior/inferior to the other two; the price swing predicted will be upwards when the spikes are upside down, or downwards when the spikes are upside.
- Flag: these patterns are continuations, meaning that they represent a price fluctuation between two lines, and the trend of the flag predicts its upward or downward movement, as in when the flag is going up the tendency is for the price to go down, and when the flag is going down the tendency is for the price to go up.
In conclusion
Analyze stock is not an easy task. Not only are there many complex terms and expressions, there are also different methods to analyze and various instruments that can also be contradictory. Despite that, it is a mechanical process, meaning that once there is a system of analysis in practice, then the only thing that changes are the data and the conclusions.
Subscribe our media posts, follow our social media accounts and learn even more by clicking in the following icons.
